Business Intelligence
BI succeeds when leadership opens it unprompted. We build governed models and role-based reporting that make the monthly numbers a habit, not an archaeology project.
Book a free consultation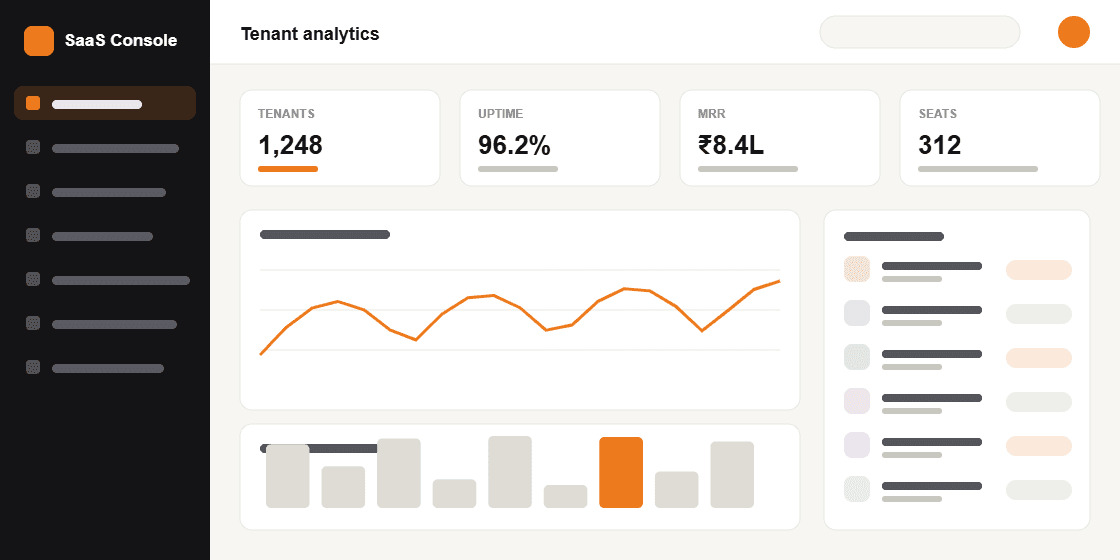
Trusted by teams across education, retail, and services
{ 01 } — BI process
Governed underneath. Effortless on top.
The dashboard is the easy layer. Underneath it we build the governance — entity models, permissions, refresh guarantees, a change-review process — that keeps it credible when the business changes and the person who built it moves on.
Model
- Business-entity modeling — customer, order, revenue, defined once
- Historical data cleanup & backfill
- Permission design — who sees what, decided deliberately
- Refresh & freshness SLAs per metric
- Sign-off from finance and operations, in writing
Publish
- Role-based dashboards at the right altitude
- Drill-down paths to the transaction underneath
- Scheduled distributions — inbox, PDF, WhatsApp
- Threshold alerts that reach a person
- Mobile-friendly views leadership actually opens
Govern
- Change review — metric edits treated like code
- Usage analytics on the BI itself
- Quarterly model evolution with the business
- Training & enablement per role
- Dashboards retired when nobody opens them
BI graveyards are full of beautiful dashboards nobody opened twice. So we instrument usage of the BI itself — which views, which roles, how often — and iterate toward what each role actually checks. A dashboard that goes unopened for a month gets fixed or retired, not defended.
Distribution meets people where they are: the CFO gets a Monday PDF, operations gets threshold alerts, analysts get modeled data to explore. Adoption is a design constraint, not a training afterthought — the habit matters more than the interface.
Underneath, the governance does the quiet work: entities defined once, permissions deliberate, metric changes reviewed like code. Leadership trusts the number because the path from KPI to transaction is short, visible, and versioned — and stays that way after we leave.
{ 03 } — What is included
From raw exports to board pack.
Governed data models
Business entities defined once — customer, order, revenue — and reused everywhere, so every report agrees by construction.
Role-based reporting
Each role sees its numbers at its altitude, drillable to the transaction underneath — no more, no less.
Automated distributions
Reports that arrive on schedule in inbox or WhatsApp — no login required, no reminder needed.
BI adoption & training
Usage tracked, gaps coached, dashboards evolved quarterly — because a dashboard nobody opens is a very expensive PNG.
Board & investor packs
The monthly pack assembled from the same governed numbers as the dashboards — no midnight reconciliation before the meeting.
Embedded & operational BI
Numbers inside the tools people already use — the ERP screen, the CRM view — instead of another tab to remember.
{ 04 } — BI stack
A stack chosen for governance, not demos.
The chart tool is the smallest decision. The semantic layer, permissions, and refresh guarantees underneath decide whether the numbers hold — so that is where the engineering goes.
{ 05 } — Ways to engage
Three ways to start, matched to your appetite.
BI foundation
A fixed-scope start: one metric domain modeled, governed, and live on role-based dashboards in 4–6 weeks. Narrow and trusted beats broad and doubted.
- Metric definitions signed off first
- One domain done end to end
- Adoption measured from day one
Build + handover
We model the entities, build the reporting and distribution layer, train each role, and hand over — with the governance process running without us.
- Your warehouse, your keys
- Change-review process installed
- Role-by-role training included
BI governance retainer
A monthly cadence for keeping BI alive — models evolved with the business, usage reviewed, dead dashboards retired before they erode trust.
- Monthly capacity, no re-scoping
- Usage reviewed, gaps coached
- Definitions evolve deliberately
{ 06 } — What you get
What a BI engagement delivers.
The visible deliverable is a set of dashboards. The durable one is the governed layer underneath that keeps them honest.
Every KPI defined once, signed off by finance and operations — the end of duelling numbers.
Clean, documented, version-controlled tables between raw data and dashboards, so reports survive schema changes and staff changes alike.
Executives, managers, and operators see the same truth at different altitudes — drillable to the transaction underneath.
Thresholds that notify a human when a number moves, and scheduled reports that arrive before anyone asks.
Sessions per team, plus usage analytics on the BI itself — because a dashboard nobody opens is a very expensive PNG.
How a metric gets changed, who approves it, and how freshness is guaranteed — the process that keeps BI credible after handover.
{ 07 } — The symptoms
Signs your reporting is costing you decisions.
If three of these sound familiar, the problem is governance — not the chart tool.
{ 08 } — What changes
From archaeology project to Monday habit.
Before
Monday's numbers arrive on Wednesday.
After
Refreshed on an agreed SLA — freshness printed on every dashboard.
Before
Two dashboards, two answers, one argument.
After
One governed model — the same number at every altitude.
Before
The revenue report depends on one person's Excel.
After
Versioned models with named owners — the report survives the person.
Before
Leadership asks; a data pull begins.
After
Leadership drills from KPI to transaction in the same view.
Before
BI judged by how it looked in the demo.
After
BI judged by who opens it unprompted — measured monthly, acted on.
Where this applies
Get expert guidance on your BI.
Book a free consultation call — a senior team member replies within one business day with real thoughts, not a sales script.
Frequently asked questions
Same foundation, different altitude: analytics engineers the metrics; BI adds the governed models, permissions, and leadership-facing reporting layer on top — plus the adoption work that decides whether any of it gets used.
Yes — cross-system joins are the core value: pipeline from CRM against revenue from ERP in one governed model, reconciled so the join itself is trustworthy.
Per metric, by agreement — some hourly, some daily; every dashboard shows its own freshness so nobody has to guess whether they are looking at yesterday.
Then dashboards come to them — scheduled PDFs, WhatsApp digests, and threshold alerts count as adoption too. The habit matters more than the interface, and we design for the habit.
The first governed domain is live on role-based dashboards in 4–6 weeks. The full rollout is deliberately incremental — each domain earns trust before the next one starts, because trust is the actual deliverable.
Governance keeps running: usage reviewed monthly, definitions evolved quarterly with the business, dead dashboards retired before they erode trust. BI is a cadence, not a project with an end date.